
An NFL win probability calculator returns a single, clean number — 73%, say — with no visible sign of how confident that number really is. Every estimate a fitted model produces carries its own uncertainty, and overfitting is the most common way that uncertainty gets hidden, not reduced: a model that looks sharper on paper is not automatically a model that has actually learned more.
The Uncertainty a Percentage Doesn’t Show
A win probability model’s output is a point estimate — the model’s best single guess, fit from however many historical plays resembled the current situation closely enough to inform it. Some game states are common: a first-and-10 in the second quarter of a one-score game has thousands of historical comparisons behind it, and the model’s estimate for that situation rests on a large, stable sample. Other game states are rare: a specific combination of down, distance, score margin, and time remaining inside the final 30 seconds of a half might have only a handful of close historical comparisons, and the model’s estimate there is built on far less evidence — even though the number displayed looks exactly as precise as the common case.
This is the gap between a model’s stated probability and the actual uncertainty behind it. A well-built model doesn’t just estimate a probability; ideally it also has some sense of how much evidence backs that estimate, though most public-facing win probability displays — including calculators built for quick lookups — show only the point estimate, not a confidence interval around it.
A purely illustrative comparison makes the gap concrete. Suppose two different plays both receive a model estimate of 62%. The first is a first-and-10 at midfield in the second quarter of a one-score game — a state that recurs constantly across a season, so the model’s 62% rests on thousands of comparable historical plays. The second is a specific fourth-and-3 from the opponent’s 38-yard line with 11 seconds left in a tied game — a state so specific that only a handful of historical plays closely resemble it. Both display as “62%,” but the second estimate is built on dramatically thinner evidence, and a small change in the training data could plausibly have shifted it several points in either direction, something a single point estimate has no way to communicate.
Overfitting: Learning Noise Instead of Signal
Overfitting is what happens when a model’s flexibility outruns the genuine signal in its training data, and it starts fitting noise — the one-off bounces, injuries, and coincidences specific to the seasons it was trained on, closer to outliers than to a repeatable pattern — not a pattern that will hold up in a new season. An overfit win probability model can look excellent by every metric computed on its own training data and then noticeably worse the moment it is checked against games it has never seen, because part of what it “learned” was specific to the training seasons and does not generalize.
Tree-based models — random forest and gradient boosting, covered in Part 2 of the building series — are particularly capable of overfitting if left unconstrained, since a deep enough ensemble of trees has enough flexibility to essentially memorize training examples instead of generalizing from them. This is managed with regularization: limiting how deep individual trees can grow, capping the number of trees, or requiring a minimum number of plays before a tree is allowed to split further. None of those settings can be chosen correctly by looking at training performance alone — they have to be tuned against data the model was not fit on (Hastie, Tibshirani & Friedman, The Elements of Statistical Learning).
The Simplest Overfitting Check: Compare Two Scores
The most direct way to detect overfitting doesn’t require anything more sophisticated than computing the same score — Brier score or log loss, from Part 3 of the building series — twice: once on the data the model was trained on, and once on data it has never seen. A large gap between the two, with training performance well ahead of held-out performance, is the standard signature of overfitting; a small gap suggests the model has learned something closer to a genuine, generalizable pattern. This comparison is worth running any time a model’s complexity changes — deepening a tree, adding a feature, adding more trees to an ensemble — since each of those changes can push the gap wider even while training-set performance keeps improving, which is precisely the trap of judging a model only by how well it fits the data it already knows.
Why the Split Method Matters More Than the Split Size
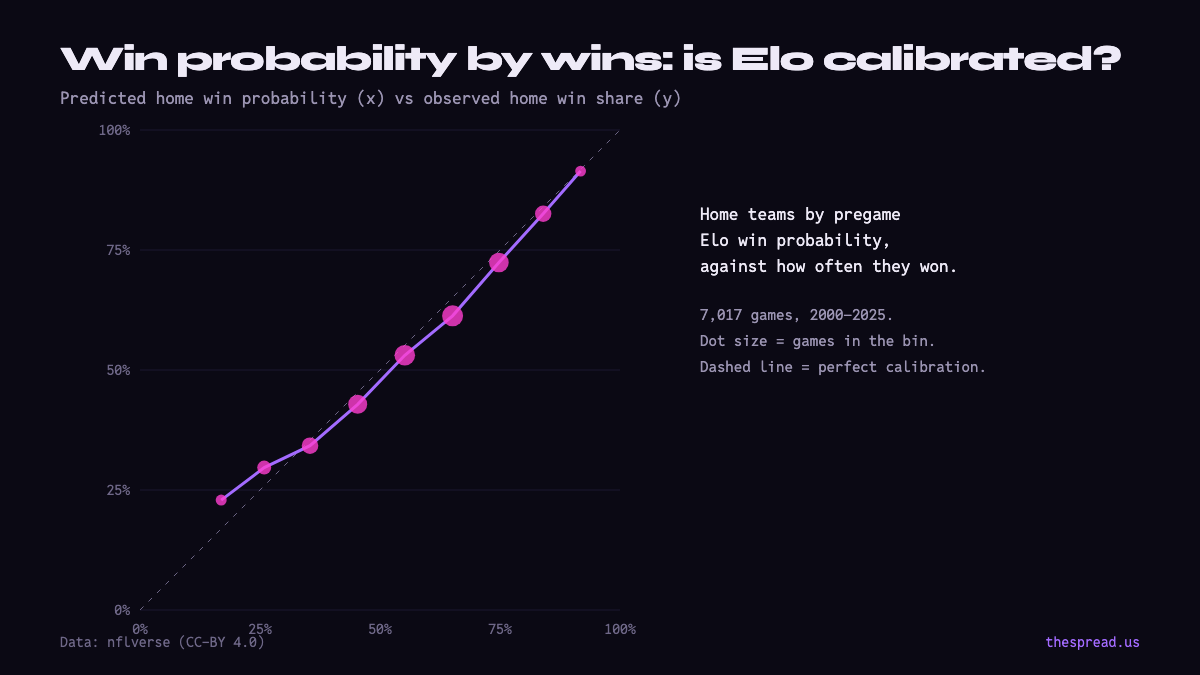
The evaluation trap described in Part 4 of the building series — splitting individual plays at random instead of splitting on whole games or seasons — is also an overfitting trap. A random split lets information from a single game leak across training and test sets, because plays within a game are correlated, which produces an evaluation score that looks better than the model has actually earned. Leave-one-season-out validation avoids this by rotating a full season out of the training set at a time, refitting the model on the rest, and checking its calibration against a season it has genuinely never touched — repeated across every available season, not relying on one lucky (or unlucky) split (Open Source Football, cited above).
Season-based validation isn’t a stronger test because it uses more data — it’s a stronger test because it respects the structure of the data. A model that stays well calibrated across many rotating held-out seasons has demonstrated something a single high accuracy number on a random split cannot: that its learned relationships hold up on football it has never encountered before.
Living With the Uncertainty That Remains
No amount of careful validation eliminates uncertainty from a win probability estimate — it only prevents a model from hiding that uncertainty behind an inflated sense of confidence. A well-validated model’s 70% is a genuinely calibrated 70%, still carrying the same one-in-three chance of being “wrong” about any individual game, the same way a properly weighted coin still lands on the less likely side sometimes. The value of guarding against overfitting isn’t a model that stops being uncertain — it’s a model whose stated uncertainty can actually be trusted.
That distinction is worth carrying into any reading of a live win probability number, whether from a broadcast graphic or a win probability calculator: the number is doing its job correctly if it is well calibrated, not if it is always right. A rare, unusual game state producing a less certain estimate than a common one is expected behavior from a properly validated model, not a sign that something has gone wrong.
Frequently asked questions
Why does a win probability number have uncertainty if it's already a probability?
The number itself is a point estimate from a fitted model, and that estimate has its own margin of error — a rare game state with few historical comparisons (a specific down, distance and score combination inside the final minute, say) produces a less reliable estimate than a common one, even though both get displayed as a single clean percentage with no visible error bar.
What is overfitting in a win probability model?
Overfitting happens when a model learns patterns specific to its training data — including noise and one-off coincidences — not the general relationship between game state and outcome. An overfit win probability model looks highly accurate on the seasons it was trained on and performs noticeably worse on new seasons it has never seen.
How can overfitting be detected in a win probability model?
By comparing performance (Brier score or log loss) on the training data against performance on held-out data the model never saw during fitting. A large gap between the two — strong performance in training, weaker performance out of sample — is the standard signature of overfitting.
Are tree-based models like random forest and gradient boosting more prone to overfitting?
They can be, if left unconstrained, because a deep enough tree ensemble can memorize idiosyncrasies of the training data instead of learning a generalizable pattern. In practice this is controlled with regularization settings — limiting tree depth, the number of trees, or requiring a minimum number of plays per leaf — checked against held-out seasons, not left to default settings.
Why does leave-one-season-out validation help guard against overfitting?
Because it never evaluates a model on data it was trained on. Rotating a full season out of the training set, refitting, and checking calibration against that excluded season repeats the overfitting check many times over, on genuinely unseen data each time, not on a single train/test split that could happen to favor the model by chance.
Does more data automatically fix overfitting?
It helps, but it isn't sufficient on its own. A model can still overfit a large dataset if it has enough capacity — enough parameters, or deep enough trees — relative to the genuine signal in the data. Validation method and model complexity both have to be managed alongside dataset size, not treated as a problem data volume alone solves.